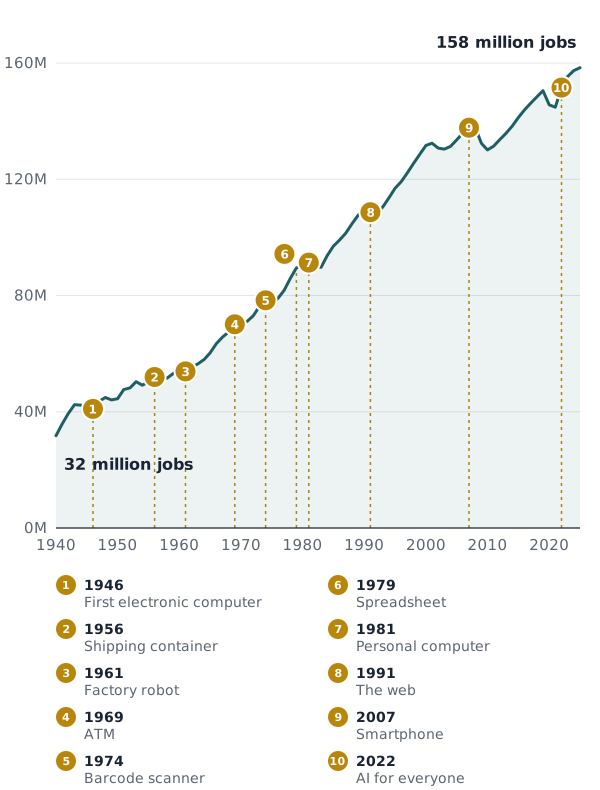
See the numbers as a table
| Year | Jobs (millions) |
|---|---|
| 1940 | 31.8 |
| 1941 | 35.8 |
| 1942 | 39.4 |
| 1943 | 42.4 |
| 1944 | 42.3 |
| 1945 | 41.4 |
| 1946 | 41.0 |
| 1947 | 43.6 |
| 1948 | 44.9 |
| 1949 | 44.1 |
| 1950 | 44.5 |
| 1951 | 47.7 |
| 1952 | 48.2 |
| 1953 | 50.3 |
| 1954 | 49.2 |
| 1955 | 50.2 |
| 1956 | 52.0 |
| 1957 | 53.0 |
| 1958 | 51.6 |
| 1959 | 53.1 |
| 1960 | 54.3 |
| 1961 | 53.9 |
| 1962 | 55.3 |
| 1963 | 56.5 |
| 1964 | 57.9 |
| 1965 | 60.3 |
| 1966 | 63.4 |
| 1967 | 65.6 |
| 1968 | 67.5 |
| 1969 | 70.1 |
| 1970 | 71.1 |
| 1971 | 71.1 |
| 1972 | 73.1 |
| 1973 | 76.3 |
| 1974 | 78.4 |
| 1975 | 77.0 |
| 1976 | 79.0 |
| 1977 | 81.8 |
| 1978 | 85.9 |
| 1979 | 89.5 |
| 1980 | 90.3 |
| 1981 | 91.3 |
| 1982 | 90.0 |
| 1983 | 89.7 |
| 1984 | 93.7 |
| 1985 | 97.0 |
| 1986 | 99.1 |
| 1987 | 101.5 |
| 1988 | 104.7 |
| 1989 | 107.6 |
| 1990 | 109.5 |
| 1991 | 108.7 |
| 1992 | 108.6 |
| 1993 | 110.4 |
| 1994 | 113.6 |
| 1995 | 116.9 |
| 1996 | 119.2 |
| 1997 | 122.2 |
| 1998 | 125.5 |
| 1999 | 128.6 |
| 2000 | 131.6 |
| 2001 | 132.4 |
| 2002 | 130.7 |
| 2003 | 130.4 |
| 2004 | 131.3 |
| 2005 | 133.5 |
| 2006 | 136.0 |
| 2007 | 137.8 |
| 2008 | 137.9 |
| 2009 | 132.4 |
| 2010 | 130.1 |
| 2011 | 131.4 |
| 2012 | 133.7 |
| 2013 | 135.8 |
| 2014 | 138.3 |
| 2015 | 141.3 |
| 2016 | 143.9 |
| 2017 | 146.2 |
| 2018 | 148.3 |
| 2019 | 150.5 |
| 2020 | 145.6 |
| 2021 | 144.8 |
| 2022 | 151.5 |
| 2023 | 155.4 |
| 2024 | 157.4 |
| 2025 | 158.4 |
Why the line kept climbing
Two findings explain it. David Autor and his colleagues at MIT matched U.S. census job titles from 1940 to 2018 and estimated that about six in ten jobs Americans held in 2018 were in occupations that did not exist in 1940. And when economist James Bessen checked the 270 occupations listed in the 1950 census, he found only one that had since disappeared mainly because of automation: elevator operator.
Most jobs changed in what people did all day, and the people in them carried the cost of that change. The free book walks through the five patterns that show up each time, and how to place your own job on the wall.
Sources
- Federal Reserve Bank of St. Louis, FRED, All Employees, Total Nonfarm (PAYEMS), data from the U.S. Bureau of Labor Statistics: fred.stlouisfed.org
- MIT News, Most work is new work, long-term data show (April 2024): news.mit.edu
- World Economic Forum, Automation has eliminated just one career in the last 60 years: weforum.org